EN
Customer area Sign in to the app Book a demo Sign up
Indicators

Decide with data, not impressions.

Everything that happens on the plantation in ready-made charts: tappings, production, revenue, quality and rainfall. No spreadsheets and no made-up numbers: everything comes from your team's records.

Dashboards

Six dashboards, six questions answered

Each dashboard answers an everyday question for the producer.

Tapping frequency

“Of the tappings that should have been done, how many were?”

  • Overall frequency and frequency per rubber tapper
  • Rankings of completed, lost, recovered and excused tappings
  • How each status evolves over time
See the area

Production

“How much did the plantation yield, and where?”

  • Production curve and estimated vs. actual
  • Production per tree, per tapping and per collection
  • By plot, by area, by clone and by rubber tapper
See the area

Revenue

“How much did you earn, compared to what you expected?”

  • Forecast vs. actual revenue, with the average price
  • Total revenue, revenue per kg and per hectare
  • Revenue and production on the same chart
See the area

Tapping quality

“Is tapping being done well?”

  • Quality ranking, with a score from 0 to 10
  • Each rubber tapper's score over time
  • Score for each cutting criterion
See the area

Rainfall

“How much did it rain, and what does that explain?”

  • Monthly rainfall in the harvest, with the total
  • Comparison between harvests and years
  • Context for excused tappings and production drops
See the area

Rubber tappers

“How much is each rubber tapper worth to your operation?”
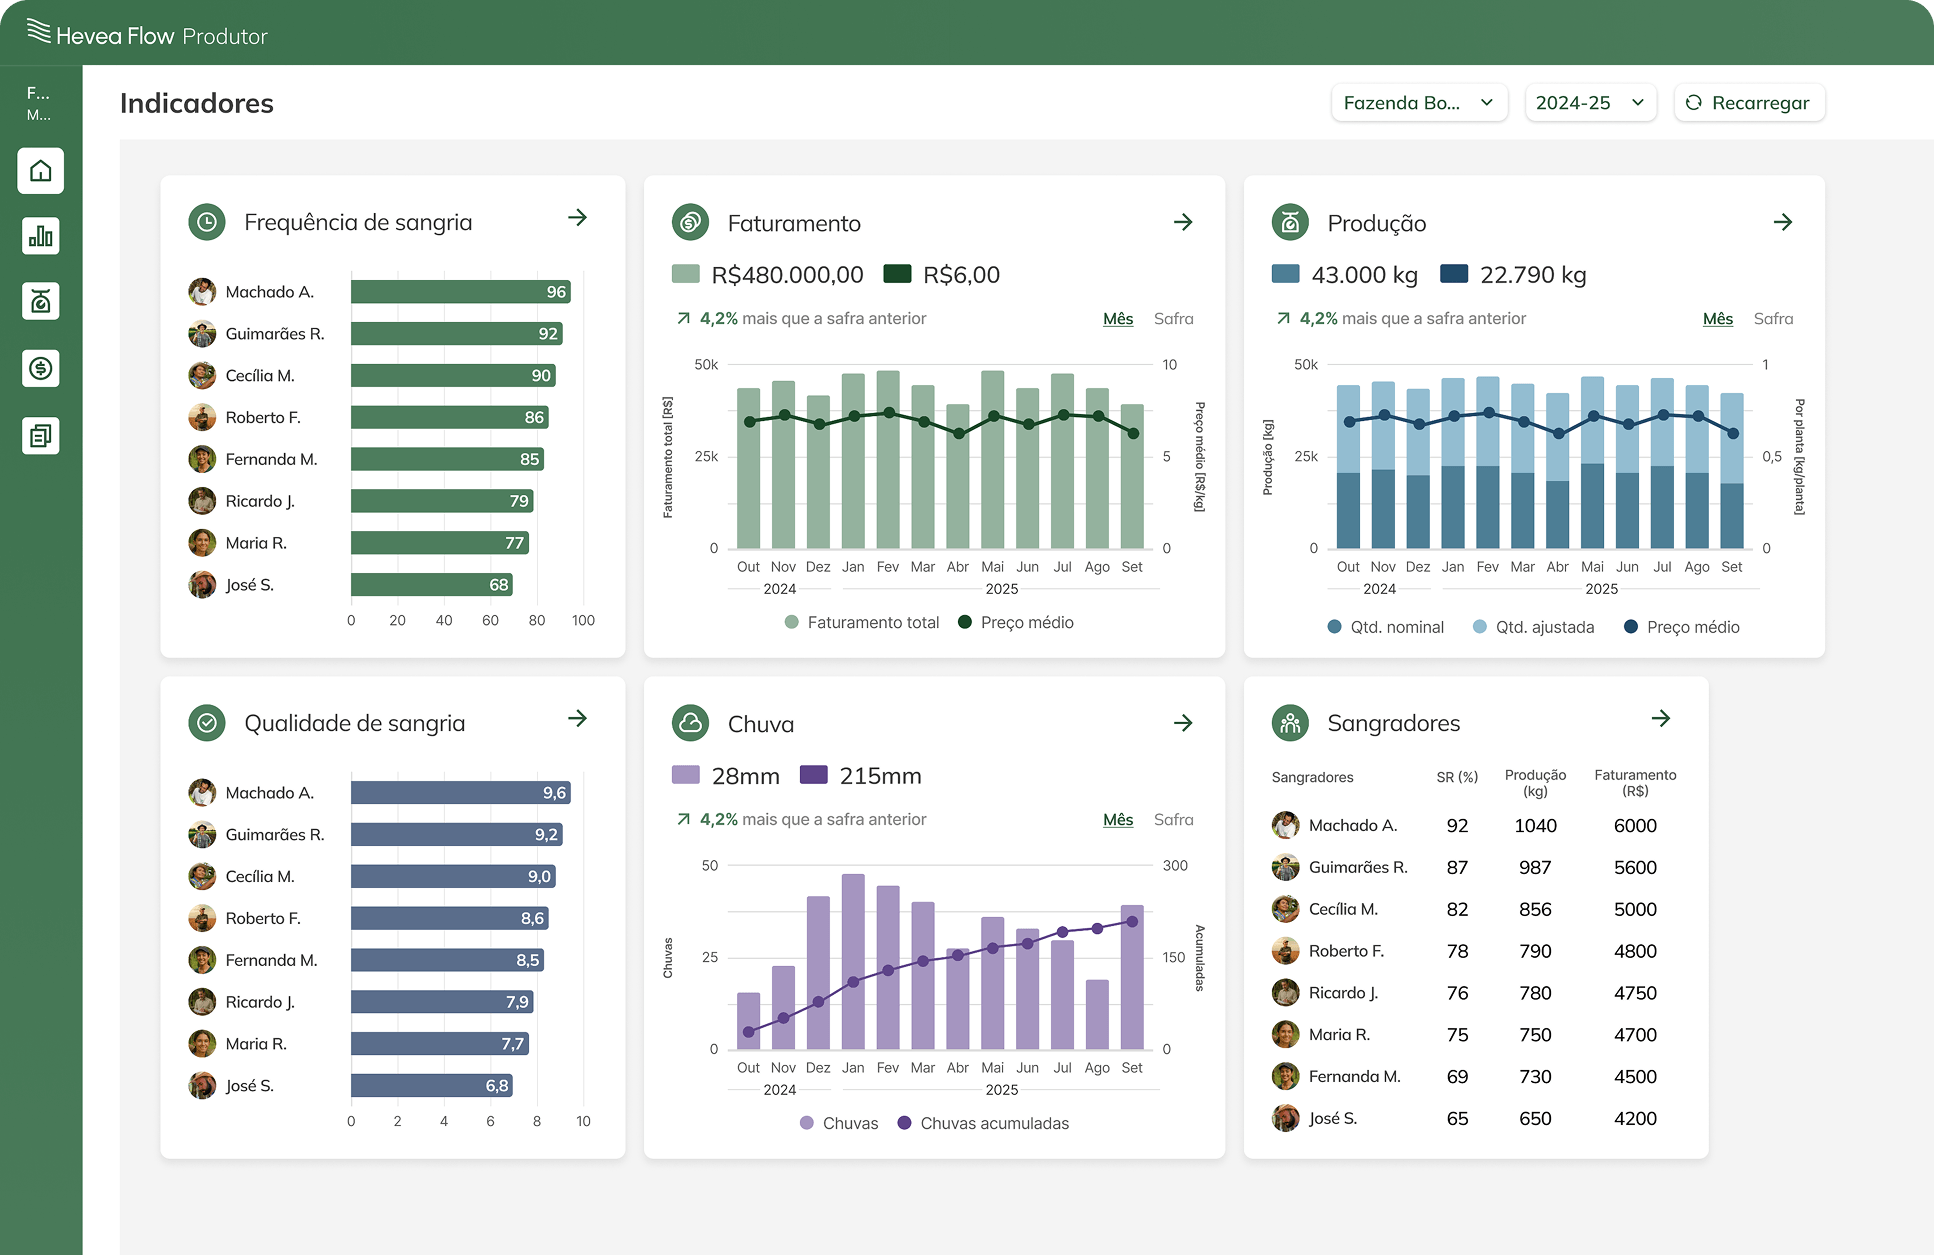
  • Production, weight per tree and revenue generated vs. received
  • Distance covered and tapping time
  • Tappings, weight and revenue lost
See the area
Hevea Flow Producer indicators dashboard
Day to day

Easy to read, easy to share

  • Filter by property, period and harvest, and group by day, week, month or year
  • Every chart explains how to read it and where the numbers come from
  • Share any chart as an image on WhatsApp or by email
  • Production adjusted to DRC 53%, free of moisture variation on the scale
AI reports

The app calculates. The AI explains.

The reports combine production, execution, quality and revenue to say why things happened and what to do. All numbers are calculated by the app; the AI only writes the reading.

PDF

Plantation Analysis

The whole property, for the month and the harvest to date.

  • Executive summary
  • Production, revenue, execution and quality
  • Prioritized recommendations
PDF

Rubber Tapper Analysis

The harvest person by person, with comparative rankings.

  • Team summary
  • One card per rubber tapper: production, execution, quality and revenue
  • Comparative rankings

You can also adjust the AI's instructions so the reading fits your operation. Available depending on the plan you subscribe to.

FAQ

Questions about indicators

Where do the indicator numbers come from?

From the records your team makes every day: tappings, collections, assessments, orders and rainfall. The app doesn't estimate or make up any number.

Can the AI get the report numbers wrong?

The AI doesn't calculate anything. All numbers are calculated by the app from your records and delivered ready. The AI only writes the reading: what happened, why and what to do.

Why is production shown adjusted to DRC 53%?

Because rubber moisture varies from one collection to another. Adjusting to 53% dry rubber, the basis on which the price is quoted, makes collections comparable.

Are the AI reports included in every plan?

No. The AI reports depend on the plan you subscribe to. See the plans.

Start managing your plantation with data

Create your account and start using Hevea Flow Producer, or book a demo with our team and get your questions answered live.

Contact us